Quantcast
Channel: OpenEnergyMonitor
Viewing all 196 articles
Browse latest View live

Pre-built heatpump dashboards

$
0
0
I've been experimenting with the idea of a pre-built heatpump dashboard - a bit like the myelectric module for home energy monitoring.

The initial concept is up on emoncms.org under the Extras > heatpump tab. The heatpump fan turns in relation to power input a bit like the winderfulwindturbine.

Configuration is by naming convention at the moment, the dashboard looks automatically for feeds named or containing the words: heatpump_power, heatpump_kwh, heatpump_flow_temp, heatpump_return_temp, ambient_temp and room_temp, using these if present.


Next I plan to extend this for heatpump monitors that also monitor either flow rate or heat output in order to show COP information including a daily power input/ heat output bar graph below the heatpump graphic.

I've been doing this work with John Cantor who is using the OpenEnergyMonitor system for heatpump monitoring.

The source code for this can be found here if youd like to try it on your own install, just drop the folder heatpump into your emoncms modules directory: https://github.com/emoncms/development/tree/master/Modules/heatpump

An open source hourly zero carbon energy system model

$
0
0
I've been doing some work recently with Philip James from the Centre for Alternative Technology on developing a set of open source zero carbon energy system models based on ZeroCarbonBritain that visualise in a javascript based web page application how energy demand can be supplied by a variable renewable energy supply using a mix of storage technologies. You can create your own scenarios, choosing how much wind, solar, storage technologies etc are used.

Its still work in progress but the models we have built so far are now online and can be explored here:
http://zerocarbonbritain.org/energy_model


The source code is all available there too as well as the original ZeroCarbonBritain spreadsheet model.

Visualising hourly surplus and shortfall:


Visualising battery, hydrogen, synthetic liquid and gas store levels:


This builds partly on findings and questions raised from our earlier work on the Snowdonia household energy study: here;http://openenergymonitor.blogspot.co.uk/2014/11/snowdonia-household-energy-study.html


The aim will be to extend that analysis to look at the amount of renewable energy and energy storage required to supply the energy demand after implementing measures like building insulation/retrofit, heatpumps and electric transport.


I find it very interesting looking at how all of these different elements can come together to create a zero carbon energy system, to understand better the relevance of different solutions. With a framework like this it becomes more possible to put ideas like smart electric car charging or excess pv diversion to immersion heaters and battery stores in context, to get a better idea of actually how much effect different solutions can have.

Introducing RFM69Pi V3 Raspberry Pi Expansion Board

$
0
0
RFM69Pi on Raspberry Pi B+, also compatible with Raspberry Pi Model B and Pi2


RFM69Pi Top View
RFM69Pi Bottom View

The RFM69Pi is a minor update to the popular RFM12Pi Raspberry Pi Expansion board. It adds support for the RFM69CW RF module as well as breaking out as much I/O as possible from the ATmega328 to open up the options for greater connectivity and compatibility. The RFM69Pi was developed with help and inspiration from Nanode RF designer Ken Boak, together we are working on a relay heating controller board using the RFM69Pi. 

The RFM69CW is backward compatible with RFM12B, see blog post introducing the module. From an end user's perspective there should be no difference when using the RFM69Pi over the RF12Pi apart from a new input called RSSI (Received Signal Strength Indication) appearing in Emoncms. 

emonHub must be updated to the latest Development branch version to enabled auto detection of the faster baud rate used by the RFM69Pi (38400 as opposed to 9600 on the RFM12Pi), and RSSI value handling. 

If you're running pre-built SD card image (emonSD-13-08-14.img or earlier) then emonHub can be updated by running:

$ sudo service emonhub stop

$ cd emonhub

$ git pull 

$ sudo service emonhub start 

check log for errors 

$ tail /var/log/emonhub/emonhub.log


The RFM69Pi is now shipping by default instead of the RFM12Pi from our online shop
http://shop.openenergymonitor.com/base-stations/

RFM69Pi Technical Docs Wiki Page:
http://wiki.openenergymonitor.org/index.php?title=RFM69Pi_V3

Open-Source Hardware Design:
https://github.com/openenergymonitor/Hardware/tree/master/RFM2Pi/board/RFM69Pi_V3.1

RFM12Pi  Default Arduino Firmware:
https://github.com/openenergymonitor/RFM2Pi/tree/master/firmware/RFM69CW_RF_Demo_ATmega328

RFM69Pi Default Firmware:
https://github.com/openenergymonitor/RFM2Pi/tree/master/firmware/RFM69CW_RF_Demo_ATmega328

RFM69CW Power Consumption

$
0
0
Following on from my post on RFM12B power consumption here's the same measurements for the RFM69CW (see RFM69CW intro blog post).

Current consumption was measured in the same way as explained in the RFM12B post back in July 2013. Voltage drop was measured across 10R current shunt resistor.

A fully populated emonTx V3.4 with a 433Mhz RFM69CW running discrete sampling code with a single CT connected was used in the test. The V3.4 was powered directly with 3.3V DC from bench PSU.

emonTx V3.4 with RFM69CW Test Setup

Test setup illustration


Test Bench
Please excuse my photos of the scope traces rather than screen captures, for some reason the USB socket on the scope did not seem to be working today :-(

Full sample and RFM69CW transmit trace capture

When an AC-AC adapter is not connected the emonTx goes to sleep in between readings. The above current trace shows the ATmega328 waking up for 295ms to sample from one CT channel the spike at the end is the RFM69CW transmitting. The trace below is a zoomed in capture of the RFM69CW transmission and LED. 

RFM69CW transmission current consumption 
The trace above shows the RFM69CW transmission: 33mA for 4ms (132mW). The current spike at the end (up to 39mA) is the emonTx LED. In this test the emonTx was running the standard discrete sampling firmware transmitting a JeeLib packet structure with six integers. Since we were only sampling from one CT four out of the five integers will be zero. 

In comparison the RFM12B consumes 25.5mA for 3ms (76.5mW)

My measurements pretty much agree with the datasheets, here's a comparison table compiled by Low Power Labs:


Even though the RFM69CW does consume more power while it's transmitting it does have a lower sleep consumption than the RFM12B. This increased transmission power should result in an increased transmission range.

I've started a forum thread for discussion: http://openenergymonitor.org/emon/node/10210

Real World emonTH Battery Life

$
0
0


The battery on my home emonTH Temperature & Humidity Node has just died for the second time in 14 months. Each set of batteries lasted exactly 221 days (7 months and 9 days)! The 2 x AA alkaline battery voltage started at 3.1V and the emonTH stopped working just after the voltage dropped below 1.2V (final dying breath was at a battery voltage of 0.8V!).  The two AA batteries installed were low cost alkaline batteries unbranded from e-spares. Battery life would not doubt be longer from some quality cells. 

I recommend using rechargeable alkaline batteries if possible in the emonTH, for least environmental impact. See my previous posts on emonTH battery selection and power consumption optimisation

My emonTH had a DHT22 temperature and humidity sensor connected and was set to the default post rate of one minute in-between samples. The unit was running V1.0 firmware (the firmware is now at V1.2, there have been a couple of minor battery life improvements). 

It's very impressive how the DC-DC boost converter onboard the emonTH continues to boost the depleting battery voltage to 3.3V, using this method allows the battery to be drained much further than powering the unit directly. 


Energy Display Options...

$
0
0
Sadly as of last week we have run out of emonGLCD kits in the shop and have decided to discontinue the emonGLCD for the moment. Preparing the through-hole kits is very labour intensive and the time and skill required to solder assemble is lagging behind our other pre-assembled SMT units.

Work has begun on a SMT pre-assembled replacement (see forum thread). However this would probably require significant investment in injection moulding tooling and commitment to high volume production. This would not would be a problem if we were sure on the design. However, I'm not sure if a standalone display is the right avenue to go down...

I am aware there that there is certainly value in an 'always on' wall mount / coffee table energy display. Being able to easily glance at the display throughout the day when your home really does remind me to switch off lights and appliances when not in use. As well as checking everything is turned off (base level energy consumption) when leaving the house. An always on display gives users a 'feel' for how much energy various devices use as the display increases or decreases in real-time as a device is switched on or turned off.

The future is mobile, everyone has at least one mobile device and increasingly as these devices are upgraded there are a large number of perfectly working just a bit slow older devices which could easily be given a second life as an energy display. This could help reduce the number of devices which end up being recycled or worse put into landfill, therefore helping to save energy in more ways the one! Old second hand Android phones or tablets can be picked up on Ebay for less than we could make an emonGLCD!

I recently repurposed an old Nexus 7 tablet (2012 model) with a cracked screen as a home energy display displaying Emoncms MyElectric. I installed an app to keep the screen on all the time when plugged in charging. The tablet uses 5W of power. An added advantage of using a mobile device as an energy display is they are 'mobile'! The display can easily be moved around the house to support investigation power consumption of various appliances.

Much work could be done on the software side to make a really nice packaged Android app for Emoncms which would support an energy display mode, useful features might be:

  • Intelligent screen-on-off e.g the display could turn off at night, when energy falls to base level consumption indicating the house is unoccupied 
  • Using the tablets motion / proximity / light sensor to sense movement to turn screen on-off
  • If device has an AMOLED display only certain pixels could be lit up to save power, like on the Moto-x Active Display 
  • Auto start at startup and full screen mode 
  • Home screen widget to be used if user does not want to decicate a devices solely as an energy display or to be placed on current mobile home screen to enable quick checking of power consumption / temperature etc when out and about.    


Emoncms MyElectric on Nexus 7 with cracked screen

A super low power alternative could be to use an old e-reader with an E-ink display. Here's Emoncms MyElectric running on a hacked Nook Touch.

Emoncms MyElectric on Nook Touch
Head over to the forums and let us know what you think...

Introducing emonPi: Raspberry Pi based energy monitor

$
0
0


emonPi Raspberry Pi based energy monitor Kickstarter

It's an exciting time for us; this week (on the 1st April, unfortunate timing!) we launched a Kickstarter crowd funding campaign for our emonPi Raspberry Pi based energy monitoring unit

The emonPi has been in development for the past 12 months or so, if you have been lurking on the forums you have probably seen activity on the emonPi's open development forum thread. Thank you everyone who contributed. 

The emonPi has been developed with input from the community, merging the monitoring unit and web-connected base station into a single easy to install and setup energy monitoring solution. 

The emonPi is fully open source hardware and software. It's been designed for maximum hackability and customisation being built on a fusion of two popular open source hardware platforms Arduino and Raspberry Pi.

emonPi Technical Features 

  • Two channel CT monitoring with AC sample input 
  • Compatible with Raspberry Pi model A, model B, model B+ and Pi 2 
  • Arduino compatible ATmega328 with ability to remotely upload sketches vis Raspberry Pi Serial 
  • RJ45 DS18B20 on-wire temperature bus to allow many temperature sensors to easily be added using a RJ45 breakout board for heat pump monitoring applications 
  • PWM and IRQ I/O's on RJ45 
  • Status LCD with function push button
  • Raspberry Pi shutdown button
  • RFM12B / RFM69CW with SMA antenna to receive or transmit data from other sensor nodes
  • Option to add OOK (on-off keying) transmitter footprint for controlling remote plugs etc. 
  • Option to add EEPROM to enable Raspberry Pi HAT compatibility (please get in contact if you have experience setting up Linux device tree). 
  • Open-source hardware, firmware and software 
  • High quality custom made, wall mountable enclosure
See the emonPi wiki for more technical info (currently under development).


We had fun filming a Kickstarter promo video, demonstrating some applications of the emonPi, Emoncms and the OpenEnergyMonitor system installed around where we are based in the mountain of North Wales, UK.  


Here's a video showing the emonPi installed and talking through how setup will work in practice. Having the LCD to show local IP address, status and uptime etc will no doubt make the system much more user friendly and accessible. 


The Kickstarter will be running until Apr 20 2015 9:46 PM BST, if we haven't reach our funding goal by then we will get nothing! Please help us share and spread the word :-)

Please help us by sharing our Kickstarter page with interested parties

We believe the opportunities and benefits of taking an open-source approach to smart monitoring and control challenges are significant; we hope to encourage others to start projects & businesses that also work towards a zero carbon future in an open way. 

emonPi Vs emonTx V3 Comparison

$
0
0
Here's a quick comparison table comparing the emonPi (currently active on Kickstarter!) to our existing emonTx V3 energy monitoring unit:

emonPi
emonTx V3


It is no secret that there is much similarity between the two units, both are cut from the same cloth. Both units use the same ATmega328 Arduino IDE compatible microcontroller and front-end CT channel signal processing which gives identical monitoring accuracy. 

The emonPi is most suitable over the emonTx V3 for home or small business whole circuit energy monitoring and also solar PV where Ethernet or WIFI can reach the consumer unit. Being a one-box-solution and with its status LCD the emonPi is quick and simple to install and maintain. 

For larger systems where there could be multiple transmitter nodes and more channels to be monitored the emonTx V3 could be most suitable. The emonTx V3 transmits it's readings via RF (433Mhz) to an emonBase web-connected base station (Raspberry Pi + RFM69Pi). Multiple emonTx V3's can be used with a single emonBase

The emonTx V3 has the edge over the emonPi when it comes to powering the unit, the emonTx V3 can be powered directly from the AC-AC adapter while also taking an AC voltage waveform sample. Due to the higher power requirements of the Raspberry Pi the emonPi requires an additional 5V DC USB adapter. 

Struggling to decide? It's also worth noting that the emonPi and emonTx V3 can work together. emonPi by default also functions as an emonBase; as well as local monitoring the emonPi can receive data via RF from multiple emonTx V3 and other remote nodes such as emonTH temperature and humidity room node. 

For further details of the units see the Technical Wiki documentation pages.


Introducing emonTH V1.5

$
0
0
The emonTH Temperature and Humidity wireless sensing room node is back in stock in the shop today with an updated version to V1.5.

http://shop.openenergymonitor.com/emonth-433mhz-temperature-humidity-node/

V1.5 is a minor hardware update adds support for RFM69CW radio and includes a DIP -switch which allows setting four RF node ID's (19-22) easily and quickly. See emonTH wiki for updated documentation

emonTH V1.5 with DT22 Temperature and Humidity Sensor
emonTH V1.5 with RF node ID DIP switch and RFM69CW


Investigating the embodied energy of the EmonPi & OSCEDays London 12-14th June.

$
0
0
On the 12th – 14th of June there is an event happening called Open Source Circular Economy Days in many cities around the world, including in London https://oscedays.org/london/ which we will be attending. I first found out about the event from Lars Zimmerman who is on the core organising team and I met last year at OuiShare, Lars runs http://openitagency.eu encouraging and helping people incorporate open source in their businesses, organisations and projects. The aim of Open Source Circular Economy Days is to bring open source thinking to the circular economy. The energy associated with manufacturing is a large part of our overall energy consumption and the question of embodied energy especially in the zero carbon energy sector is particularly important to understand better. There is quite a bit of discussion at the moment about the level of energy return on energy invested EROI required from the zero carbon energy sector as a whole in order to sustain a certain level of technological society.

My impression of trying to look into embodied energy and life cycle analysis is that it seems that the measurement of embodied energy and other impacts associated with manufacturing our stuff and then the understanding of what solutions are available to reduce this embodied energy, especially in electronics is still in its infancy compared with other energy demands that we are more familiar with like the solutions available for space heating and transport, both of which have solutions that can achieve 70-90% energy reductions without reducing the level of comfort or distance travelled http://openenergymonitor.org/emon/sustainable-energy.

We're particular conscious of this question at OpenEnergyMonitor as we get our hardware manufactured and see the quantity of stuff involved in the production of our equipment. It has always been interesting to read about developments from other projects and companies who have been looking at this for sometime but in different fields predominantly outdoor clothing: http://www.patagonia.com/us/footprint and http://www.howies.co.uk. They have often achieved quite substantial improvements by looking at their materials, and supply chains in detail.

With Open Source Circular Economy Days coming up and after talking to Erica Purvis of http://technicalnature.org.uk/ who is one of the organisers of the London even we decided to try and sketch out a draft initial analysis of the embodied energy associated with the emonpi to take along with us. I emphasised its initial status there because I don’t have a high confidence in the reliability  of the data at the moment but I think it does provide a useful start on which further detailed research can be done.

Embodied Energy Audit Process

With a little research I found an example of an embodied energy analysis for an LED light with an accompanying dataset for the embodied energy of different components here: http://users.humboldt.edu/arne/Alstone_etal_Lumina-TR9-Embodied-Energy_Jan11.pdf this example referenced data from the European commission project  Eco-design of energy-using products: http://ec.europa.eu/enterprise/policies/sustainable-business/ecodesign/methodology/files/eup_ecoreport_v5_en.xls.

I then calculated an estimate for embodied energy by using the embodied energy dataset from these two sources and a detailed list of components for the emonpi including the weight of each component. The spreadsheet with the calculation can be downloaded here on the EmonPI open hardware github repository:

https://github.com/openenergymonitor/Hardware/raw/master/emonPi/emonPi_V1_5/emonpi_embodiedenergy.ods

here's a screenshot of what it looks like:


I have summarised the main results in these two graphics:

Interestingly the application of the embodied energy values in the dataset suggest that at least for the parts that we are most involved in the custom design of (The EmonPi Shield and the aluminium enclosure) the embodied energy is dominated first by the enclosure at 10.1 kWh and then by the manufacturing of the printed circuit board (2.2 kWh) and the assembly of the unit (1.6 kWh). The integrated circuits only account for a relatively small percentage at 0.2 kWh.

Aluminium enclosures
The estimate for the embodied energy of the aluminium enclosure is based on the 40 kWh/kg figure in Sustainable Energy without the hot air. This equates to 144 MJ/kg which is lower than a couple of other figures I could find for standard aluminium embodied energy. The Wikipedia figure is 155MJ/kg and is based on a 33% recycling rate. The figures I could find for the embodied energy for aluminium from bauxite where between 191MJ/kg and 342MJ/kg. The enclosure made from aluminium from bauxite could at the higher end use 24 kWh and at the lower end require 16 kWh. 100% Recycled aluminium however only requires between 11.35MJ/kg and 17MJ/kg. The EmonPi manufactured from 100% recycled aluminium would therefore only need between 0.9 - 1.3 kWh to manufacture. The EmonTH ABS plastic case is about a third of the size of the EmonPI case and weighs 32g it had an embodied energy of around 1.0 kWh (111MJ/kg). A plastic EmonPi case might weight about 3x this (~90 grams) and so may use around 3.0 kWh. The aluminium would need have been recycled around 7-8 times to achieve the same level of embodied energy as an ABS plastic enclosure. There are also lower embodied energy plastics available such as Polypropylene (64-94MJ/kg) and recycled PET  may use around 42-55MJ/kg and then perhaps there are even more options in the design of enclosures to minimise the amount of material used.

Manufacture of printed circuit boards and assembly

Beyond learning more about enclosure options it would be useful to focus on getting a better idea for the reliability of the data for printed circuit board manufacturing and assembly and what options exist to lower their embodied energy requirements.

OSCEDays
If your interested in learning more about the Open Source Circular Economy days event or joining us at the event in London have a look at the event pages here:
https://oscedays.org
https://oscedays.org/london

Useful links and references:

EmonTx v2.5 and throughhole kits

$
0
0
We've had quite a few people ask about the throughhole emontx v2 and emonGLCD's designs since we've moved away from stocking them in the shop and developed the pre assembled units. I've also had several conversations with people offline who said how much they enjoyed building the kits and encouraged us to keep supporting and stocking them. The challenge is the complexity of running an online shop with many different product lines and the additional workload of kiting and stock ordering - but it seems like it might be worthwhile for us to look into a way to make it possible.

The emontx v2 currently uses different 3.5mm jacks to the emontx v3 and emontx shield, It also required a different case which needed milling to use. To try and standardise on the components required I've been working on a new version that is designed to fit in the emonTH case that doesn't require milling and uses the higher quality 3.5mm jacks used on the emontx v3 and emontx shield.

As I got stuck in to the design I thought Id add the powering via AC circuitry that's on the emontx v3 and find a way of ensuring all spare IO is available + the addition of a row of terminal blocks with power, ADC's and digital IO breakout in much the same style the EmonTH.

The first revision of this new design is now available on github here:
https://github.com/openenergymonitor/Hardware/tree/master/emonTxV2.5

and looks like this (im really quite pleased with how it turned out, there's something quite satisfying about designing and routing together a pcb, trying to find neat layouts and so on):


The main features are:
  • 2x CT sensor inputs using higher quality 3.5mm jacks used on the EmonTx v3 and emontx shield
  • 1x ACAC Voltage sensing and power input
  • Terminal block power, ADC's and Digital IO breakout + full spare IO breakout.
  • Onboard DS18B20 footprint
  • Based around ATmega328 + RFM69 core
  • Fits in emonTH enclosure
The main downside perhaps of this design is that in order to get it into the emonTH case I needed to drop the number of CT inputs down from 3 to 2, the thinking being that most applications are house consumption + solar pv. But Im aware that this does make is unsuitable for 3 phase application, we do want to develop a dedicated 3 phase board design with voltage sensing on each phase so perhaps that's the better option for 3 phase application than using the emontx.

I've sent off for a first prototype PCB from ragworm so will be building and testing this design hopefully next week. Id welcome thoughts on the design and any suggestions and may do another revision before getting these made in quantity.

Common component kit

The other idea we've had is that since the emonglcd and emontx kit share so many of the same resistors and capacitors we could potentially offer a general openenergymonitor throughhole component kit with enough of the common components to build an emonglcd or several emontx kits. Then alongside the common component kit would be the PCB and emontx/emonglcd specific components such as the LCD, connectors and perhaps the atmega. We're' just working out the pricing for this. This could be quite a good option for people who have good home electronics stocks of different resistors/capacitors and could simplify the kitting for us with just one kit with 10x 20x of all the different resistors and capacitors. Interested in hearing people's thoughts on the idea.

This blog post is a repost from the forum thread here: http://openenergymonitor.org/emon/node/10802

Modelling hourly demand and supply for renewable powered domestic electricity, heating with heatpumps and electric vehicles

$
0
0


Earlier this year I did some work with Philip James from the Centre for Alternative Technology and a researcher on the ZeroCarbonBritain project on creating an open source online zero carbon energy modelling tool based on the ZeroCarbonBritain model which is one of the Uk's leading energy scenarios outlining a positive, aspirational 100% renewable zero carbon energy future.

This first tool is available online here and blog post, using it it is possible to explore how its possible to supply energy demands such as space heating and electric vehicles from a variable renewable supply consisting of wind, solar, tide and wave power and a mix of storage technologies. The model models supply and demand on an hourly basis which is a significant improvement over simpler annual models.

Understanding its workings
I had been wanting to dig down deeper into the workings of the model and unpick the effect of the different model components, the full model has so many different things going on that its hard to see how each component such as space heating demand from heatpumps, space heating profiles, electric vehicle charging profiles, water heating, or different generation technologies affects the bigger picture of the overall supply/demand balance and resulting storage requirements and so over the last month and a half I've spent some time looking into this in more detail.

Python and javascript example models
I started by writing a series of python models that modelled many of the key components in turn using the full 10 year hourly dataset used in the ZeroCarbonBritain spreadsheet model, exploring the level of supply/demand matching for each generation technology. As I started to model some of the more complex demands such as space heating from heatpumps, including the effect of solar and internal gains, I needed to be able to see what was going on in more detail so I converted the models to javascript and wrote a data viewer using flot.

Online visual tool
I've put all these model examples together into an online tool and added alongside each model a brief analysis and extended results of the many model run's I ran with different parameters. The tool also includes an introduction and overview of the uk energy context which is intended to help put the model examples which focus on domestic traditional electricity demand, space heating and electric transport in context. This tool is now available online here:


Launch online zero carbon energy system example models: http://openenergymonitor.org/energymodel

and its all open source with the code and full website on github here:
https://github.com/TrystanLea/zcem

The tool covers the following model examples and context pages:

    Introduction
    Energy Overview
    1. Variable supply
    2. Variable supply and flat demand
    3. Variable supply, traditional electricity demand and oversupply
    4. Mixed supply and flat demand
    5. Variable supply and space heating demand
    6. Electric Vehicles
    7. All
    Aggregation
    ZCB Dataset
    ZCB web model
    Python models

I have found it really interesting doing this work, but it also feels like a chapter early on in a large book. There is a lot more I'd like to understand in more detail and expand on which I hope to continue with over time.

Hourly energy model example 1: Variable Supply

$
0
0
This first example in the hourly energy modelling tool model's the hourly output of a given installed capacity of wind, wave, tidal or solar. The model really isn’t doing much its just loading the capacity factors for every hour from the 10 year dataset and multiplying the capacity factor by the installed capacity.

The total electricity generated is calculated as the sum of the electricity generation in each hour and printed along with the capacity factor at the end.

This example is useful for just seeing what the ZeroCarbonBritain renewable capacity factor dataset looks like, you can zoom and pan through the datasets for onshore wind, offshore wind, tidal, wave and solar pv, click on the link below to open the tool:
  
Online tool:http://openenergymonitor.org/energymodel> navigate to 1. variable supply

The units are really not important the example could just as well be in MW's or GW's. kW's where chosen as the other model examples in the series are focused around building a hourly model that's relatable to an average households energy demand. The kW's of installed capacity could just relate to a small share of a much larger wind turbine, solar farm, wave or tidal power installation.

Running the model for each of these generation types with the same installed capacity the results are as follows:

Onshore windOffshore windWaveTidalSolar
Installed capacity1.0kW1.0kW1.0kW1.0kW1.0kW
Annual generation2834 kWh4204 kWh2482 kWh2092 kWh826 kWh
Capacity factor32%47%28%23%9%

In all of the examples above the installed capacity of the renewable generator was the same (1.0kW) but we can see straight away that there is a significant difference in the total electricity generated by each type. A unit of offshore wind generates just over 5 times as much energy as a unit of solar pv using the zerocarbonbritain dataset. By itself this is not enough information to evaluate the effectiveness of a technology, we would need to compare the costs per unit of installed capacity, embodied energy per unit of installed capacity, how well a particular solution matches demand, the land areas required, the availability of the resource to name just a few of the many factors that need to be weighed up but it does highlight one of the important factors.

Python example source code
Alongside the online javascript modelling tool there are a series of python versions of the examples which are simpler to follow as they dont include all the code to create the visual output, they just print out the main results at the end.

The following 19 lines of python code are all you need to load the ZeroCarbonBritain dataset and run through all 87,648 hours, calculating the power output for each hour and accumulating the total energy supplied over the 10 year model period:

# dataset index:
# 0:onshore wind, 1:offshore wind, 2:wave, 3:tidal, 4:solar, 5:traditional electricity
gen_type = 4

installed_capacity = 1.0 # kW

# Load dataset
with open("../dataset/tenyearsdata.csv") as f:
    content = f.readlines()
hours = len(content)

print "Total hours in dataset: "+str(hours)+" hours"

total_supply = 0

for hour in range(0, hours):
    values = content[hour].split(",")
   
    supply = float(values[gen_type]) * installed_capacity
    total_supply += supply

capacity_factor = total_supply / (installed_capacity*hours) * 100

print "Installed capacity: %s kW" % installed_capacity
print "Total supply: %d kWh" % total_supply
print "Capacity factor: %0.2f%%" % capacity_factor


Next: Variable supply and flat demand - investigating the degree of supply/demand matching

Hourly energy model example 2: Variable supply and flat demand (python code included)

$
0
0
The second example in the hourly energy modelling tool models the degree of supply/demand matching between a variable renewable supply consisting of a single renewable energy generation type and a flat electricity demand profile.

A flat demand may not of course be particularly realistic and the more complex examples later on address this, but I've used it here just to illustrate this particular simple example case.


Online tool:http://openenergymonitor.org/energymodel> navigate to 2. variable supply and flat demand
 
The demand is subtracted from the supply for every hour in the 10 year period and the total amount of unmet demand and excess generation is measured as well as the amount of time the supply was more than or equal to the demand.

The demand level is set to an annual average electricity demand of 3300 kWh which is the average UK household annual electricity consumption. The amount of installed capacity is set to match this demand on the 10 year basis of the dataset.

Running the model for each of each generation type, matching total 10 year supply to total 10 year demand of 3300 kWh x 10 we get the following results:

Onshore windOffshore windWaveTidalSolar
Installed capacity1.17kW0.79kW1.33kW1.58kW3.98kW
Percentage of demand
supplied directly
65.9%76.4%73.9%57.7%40.6%
Percentage of time demand is
more or the same as the supply
40.1%46.2%45.3%38.6%32.1%


We can see again here that offshore wind is the clear winner with the lowest installed capacity requirement and highest level of supply/demand matching. Perhaps an interesting result is how less predictable technologies such as wind and wave provide greater levels of matching than power from tidal which is very predictable.

Python example source code
Alongside the online javascript modelling tool there are a series of python versions of the examples which are simpler to follow as they dont include all the code to create the visual output, they just print out the main results at the end.

I've highlighted the main parts in bold below:

# dataset index:
# 0:onshore wind, 1:offshore wind, 2:wave, 3:tidal, 4:solar, 5:traditional electricity
gen_type = 1

installed_capacity = 0.785 # kW

annual_house_demand = 3300 # kWh
house_power = (annual_house_demand * 10.0) / 87648  

# Load dataset
with open("../dataset/tenyearsdata.csv") as f:
    content = f.readlines()
hours = len(content)

print "Total hours in dataset: "+str(hours)+" hours"
print

total_supply = 0
total_demand = 0

exess_generation = 0
unmet_demand = 0

hours_met = 0


# for every hour in the dataset
for hour in range(0, hours):
    values = content[hour].split(",")
    

    # calculate the supply
    supply = float(values[gen_type]) * installed_capacity
    total_supply += supply
    

    # calculate demand
    demand = house_power
    total_demand += demand
    

    # subtract demand from supply to find the balance
    balance = supply - demand
    

    # record the total amount of exess and unmet demand
    if balance>=0:
        exess_generation += balance
        hours_met += 1
    else:
        unmet_demand += -balance

capacity_factor = total_supply / (installed_capacity*hours) * 100

prc_demand_supplied = ((total_demand - unmet_demand) / total_demand) * 100

prc_time_met = (1.0 * hours_met / hours) * 100


# print out the results

print "Installed capacity: %s kW" % installed_capacity
print "Capacity factor: %d%%" % capacity_factor
print
print "Total supply: %d kWh" % total_supply
print "Total demand: %d kWh" % total_demand
print
print "Exess generation %d kWh" % exess_generation
print "Unmet demand %d kWh" % unmet_demand
print
print "Percentage of demand supplied directly %d%%" % prc_demand_supplied
print "Percentage of time supply was more or the same as the demand %d%%" % prc_time_met

Hourly energy model example 3: Variable supply and traditional electricity demand

$
0
0
The ZeroCarbonBritain dataset includes 10 years of hourly traditional electricity demand data for the UK. The previous example compared renewable supply data with a flat demand profile, this example explores the effect of the variable traditional electricity demand profile with its day time peaks and night time low on supply/demand matching for the different renewable energy generators.

The screenshot below gives a flavour for what the traditional electricity demand profile looks like in blue, the black line is the supply from onshore wind, using the tool you can compare traditional electricity demand to: onshore wind, offshore wind, tidal, wave and solar power.


Online tool:http://openenergymonitor.org/energymodel> navigate to 3. Variable supply, traditional electricity demand and oversupply

These are the results for the amount of demand supplied directly for each generation type, matching annual supply totals with demand totals:

Onshore windOffshore windWaveTidalSolar
Installed capacity1.17kW0.79kW1.33kW1.58kW3.98kW
Percentage of demand
supplied directly
66.5%76.7%75.2%57.0%42.1%
Percentage of time demand is
more or the same as the supply
40.7%46.5%44.7%38.7%31.1%

Interestingly they only change marginally. Solar PV makes a gain 2% on the demand supplied directly which reflects higher demand in the day vs night time and we see a couple of other 1% changes but the differences are quite marginal and smaller than the difference between each renewable energy type so we don’t really see any change of order.

Increasing the degree of supply/demand matching between a variable renewable supply and traditional electricity demand by over supply

The are multiple ways of increasing the level of supply/demand matching or reducing the unmet demand. Over-supply is one way we can do this and is one of the measures used in the ZeroCarbonBritain scenario. In the previous examples we sized the installed capacity of the renewable electricity generating technologies to produce over the 10 year model period the exact same amount of electricity as was used in the 10 year period.
We can re-run the same model but with installed capacity amounts set to 110%, 120% or 130% of demand

Oversupply: 110%
Onshore windOffshore windWaveTidalSolar
Installed capacity1.28kW0.86kW1.46kW1.74kW4.39kW
Percentage of demand
supplied directly
68.9%79.6%77.958.9%43.0%
Percentage of time demand is
more or the same as the supply
44.1%51.8%50.0%41.7%32.4%

Oversupply: 120%
Onshore windOffshore windWaveTidalSolar
Installed capacity1.28kW0.94kW1.60kW1.89kW4.79kW
Percentage of demand
supplied directly
71.1%81.9%80.3%60.4%43.8%
Percentage of time demand is
more or the same as the supply
47.2%56.5%54.3%44.3%33.5%

Oversupply: 130%
Onshore windOffshore windWaveTidalSolar
Installed capacity1.51kW1.02kW1.73kW2.05kW5.19kW
Percentage of demand
supplied directly
72.9%83.9%82.2%61.7%44.5%
Percentage of time demand is
more or the same as the supply
50.1%60.7%58.1%46.7%34.4%

For every 10% of demand increase in supply we see 1-3% improvements in the percentage of demand supplied directly and 1-5% improvements in the amount of time demand is more or the same as supply.

The python code for the above examples is very similar to the previous example for the flat demand profile and can be downloaded here: http://openenergymonitor.org/energymodel/#python

The next example looks at the question of complementarity between different renewable energy types and asks the question what might the optimum capacity mix point be between wind and solar for a given electricity price point.

Hourly energy model example 4: Complementarity of different renewable generating technologies

$
0
0
We hear a lot that a renewable energy system benefits from having a mix of generating technologies. Combining wind and solar for example is said to provide a higher supply/demand matching than relying on one technology alone. When the wind isn’t blowing it may be sunny or vice versa.
How do we work out the best mix of different renewable generating technologies. When is it cheaper to add more wind than to add more solar, what is the balance point for a particular demand profile?

This example explore's the balance point for onshore wind + solar, both having large resource availabilities associated with them. The mix will be balanced based on energy cost. It would also be good to explore the balance based on embodied energy. As with all modelling based on costs the outcome will change as costs change, the important thing here is to understand the method so that we can explore for a given set of costs what the optimum mix might be.
In the recent contracts for a difference auction in the UK for renewable generation many of the onshore wind farms received a strike price of £82.50 per MWh. Two offshore wind projects received £115 per MWh and three solar farms received £79.23 per MWh.
Source: Contracts for Difference Auction Results

In this example we will use these cost figures, the ZCB capacity dataset for onshore wind and solar and a simple flat demand profile.

If we look at the results from example 2 investigating annual matching for wind and solar and add in the cost information:
  • 1.164kW of onshore wind delivers 3300 kWh/y at £272/y and a supply/demand matching of 65.88%.
  • 3.99kW of solar delivers 3300 kWh/y at £261/y and a supply/demand matching of 40.61%.
One way to investigate the best mix is to fix the total annual energy cost and change the installed capacities of both solar and wind to achieve the greatest level of matching for a given energy cost.

So lets take an annual energy cost of £272 and work out for this cost what is the maximum level of matching we can obtain from a wind + solar mix.


Online tool:http://openenergymonitor.org/energymodel> navigate to 4. Mixed supply and flat demand

CostWind capacitySolar capacityMatching
£272.021.1635065.86 %
£272.031.02350.570.04 %
£272.030.93950.871.22 %
£272.030.91150.971.33%
£272.040.89750.9571.35%
£272.040.88351.071.34 %
£272.040.86951.0571.31 %
£272.040.85551.171.26 %
£272.040.82751.271.09%

At an energy cost of £272/year a flat demand and the ZCB dataset we can see a clear benefit from combining solar and wind in the energy mix, increasing solar pv capacity appears to make sense up to 105.8% of installed wind capacity after which the matching starts to drop again for the given energy cost.

Its important to note however that wind still provides the majority of the electricity at 2543 kWh of the 3300 kWh generated annually (76%). This is because of wind's higher capacity factor in comparison with solar.

How does the mix change if we decide to oversupply and pay a higher cost for the electricity. If we fix our annual cost to say £320

CostWind capacitySolar capacityMatching
£320.061.369069.88 %
£320.071.2290.573.98 %
£320.081.1440.875.20 %
£320.081.0891.075.44 %
£320.081.0751.0575.45 %
£320.081.0611.175.44 %
£320.081.0471.1575.41 %
£320.081.0331.275.37 %

The maximum matching we obtained in this case happened where solar capacity was 97.7% of wind capacity.

It appears that in these model runs, the optimal mix between solar and wind is to install an equal capacity of both, its interesting that this happens to be the case and that its not say half the wind capacity. The model results confirm the often discussed complementarity between solar and wind supply and that the benefit of their combination increases supply demand matching by around 5% points for no additional cost and is a similar scale of supply/demand matching improvement seen by increasing the oversupply of wind to 120% of demand but without the additional cost.

Download python model:
http://openenergymonitor.org/energymodel/python/windandsun.py

Optical Utility Meter LED Pulse Sensor

$
0
0
Optical Utility Meter LED Pulse Sensor attached to meter via removable sticky pad

We have just taken delivery of a batch of custom made Optical Utility Meter LED Pulse Sensor units. We're very excited about these new sensors, they will enable the emonPi and emonTx to interface directly with Utility Meters measuring exactly the amount of energy being measured by the utility meter.

The Optical Pulse Sensor works by sensing the LED pulse output from utility meters. Each pulse corresponds to a certain amount of energy passing through the meter. The amount of energy each pulse corresponds to depends on the meter. By counting these pulses the meters KWh value can be calculated.

Unlike clip-on CT based monitoring pulse counting is measuring exactly what the utility meter is measuring i.e. what you get billed for. The pulse counting cannot provide an instantaneous power reading like CT based can. Where possible we recommend using pulse counting in conjunction with CT monitoring. The emonPi and emonTx can simultaneously perform pulse counting and CT based monitoring.

In the future we plan to look at how the pulse counting energy value can be used to calibrate the CT based power calculations.

The Optical Pulse sensor will work plug-and-play with emonPi / emonTx connecting via RJ45 socket, older units will require a firmware update. See documentation page for update instructions.

Optical Pulse Sensor Documentation Page

Optical Pulse Sensor is now available to purchase from the OpenEnergyMonitor online shop

If you have backed us on Kickstarter or have purchased an emonPi from us as a thank you for your support we would like to offer you 20% off the Optical Pulse Sensor, use code PYN5031978E9T at checkout (valid until 1st July 2015).


Pulse sensor installed & connected to emonPi via RJ45


Green LED on sensor flashes in sync with LED pulse

Big box of pulse sensors arrived today! :-) 

Hourly energy model example 5: Simple space heating model with heatpump's powered by renewable energy

$
0
0
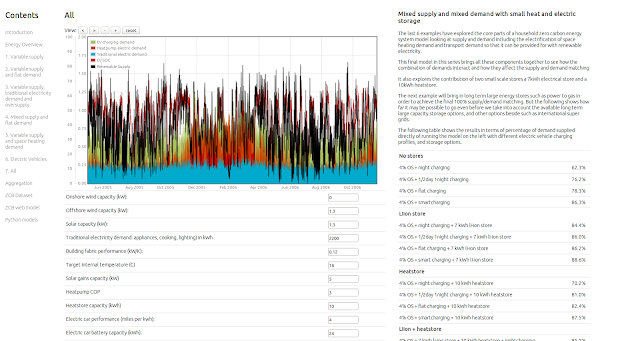
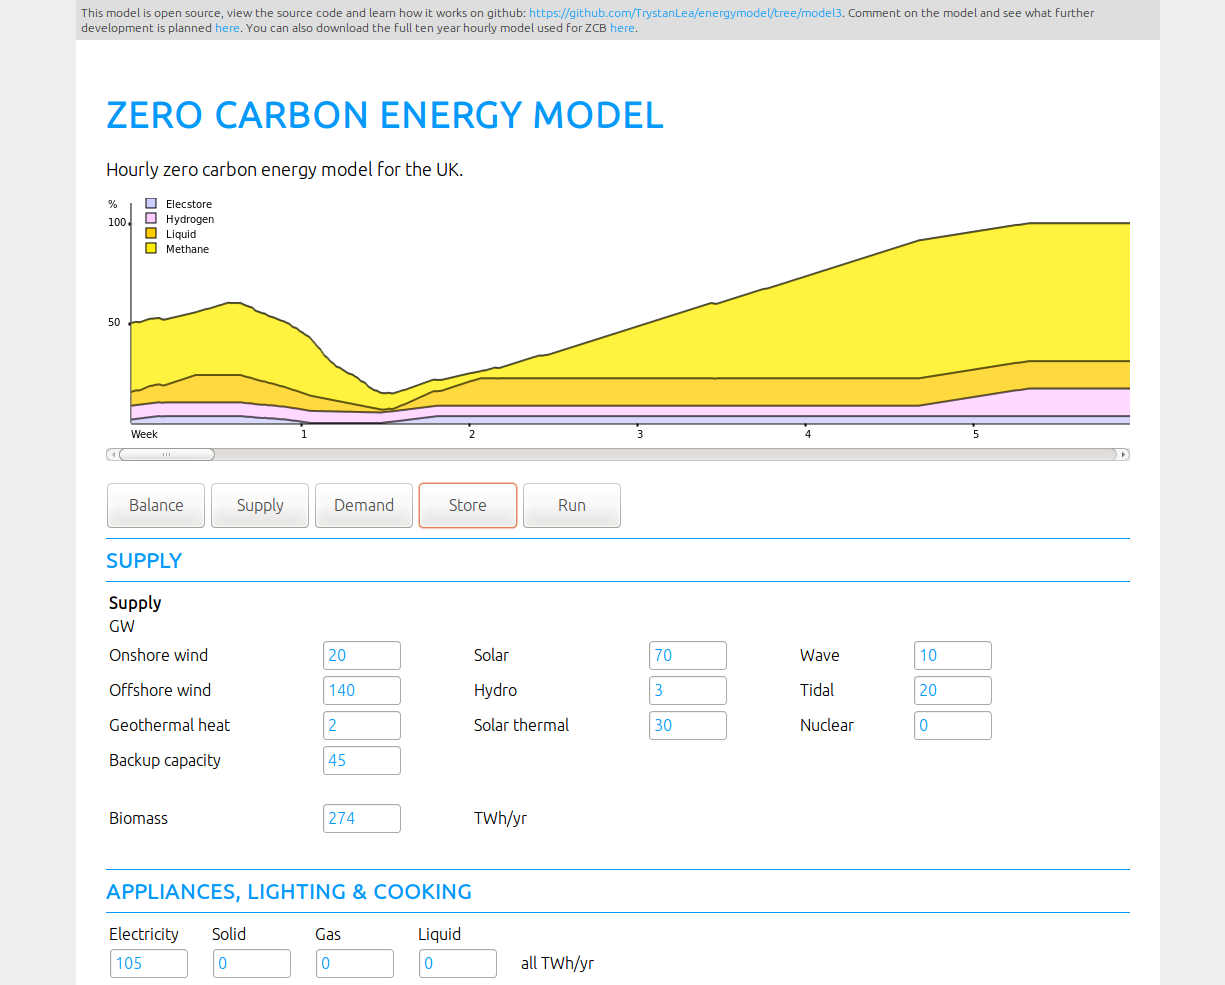
The 5th example in the online zero carbon energy modelling tool is where it starts to get more interesting: modelling the supply/demand matching between a variable renewable supply and space heating delivered by heatpumps. The electrification of heating with heatpumps so that heating can be supplied with renewable electricity is one of the key solutions used in ZeroCarbonBritain and Sustainable energy without the hot air.


Online tool:http://openenergymonitor.org/energymodel> navigate to 5. Variable supply and space heating demand

The ZeroCarbonBritain dataset includes weighted daily temperatures for 10 years. This dataset can be combined with the solar dataset and a basic household energy model to create a seasonal heating demand model.

Solar gains are an important aspect of space heating. Using 
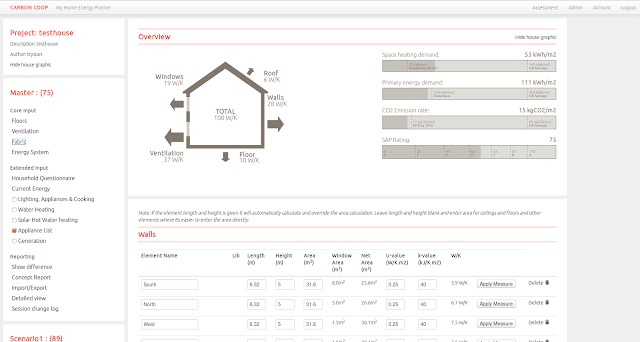
MyHomeEnergyPlanner (The open source retrofit modelling tool we are developing with Carbon Coop) to model a concept low energy house with fabric energy efficiency of 120W/K and a total of 16m2 of window area on a 80m2 (floor area) house with external surface area 206.4m2 the maximum potential annual solar gains where calculated to be 4429 kWh.

MyHomeEnergyPlanner: http://github.com/emoncms/MyHomeEnergyPlanner
Running a low electricity demand of 2200 kWh a year and taking into account the solar gains. The space heating demand is only 4,247 kWh/year (compared to 13500 kWh/year for a typical house today a 68% space heating energy saving). If that remaining heat demand is supplied by a heatpump the electrical input should be 1,416 kWh/year.

Building an hourly space heating model:

In order to calculate the space heating demand the model first calculates the total heating demand before solar gains and internal gains are taken into account. The space heating demand assumes constant internal temperature target of 18.5C rather than a morning and evening heating period. A further example with a higher internal temperature and variable profile would worth exploring for comparison. (21.0C being the passivhaus internal temperature target and there is an interesting discussion about the role of heating profiles, heatpump performance and demand spikes)

The model then subtracts the internal gains (heat given off by appliances/cooking/lights etc) and the heat provided by solar gains through the windows, we use the solar pv capacity factor dataset here to provide our solar irradiance dataset. The amount of solar gain was scaled to match the amount of solar gain calculated in the SAP MyHomeEnergyPlanner tool based on the window orientations and areas – the total available solar gain energy is equivalent of 5.0 kW of solar pv.

The model also keeps track of unused solar and internal gains when the internal temperature is already at the target temperature. The assumption at this point is that the excess heat is dumped outside perhaps through increased ventilation.

The space heating demand after internal and solar gains are taken into account is then supplied with a heatpump with the simplifying assumption that the COP is constant and the heatpump fully responsive. A more complex model taking into account a degree of thermal mass in the building and the dynamics of the heatpump cross checked with real data would be useful here to check the assumptions taken in order to create an initial simplified model.

Running the same fabric energy efficiency, max available solar gains and internal gains through this hourly model gives a space heating demand that is 14% higher than the space heating demand calculated with the SAP based MyHomeEnergyPlanner. The difference may be due to the differences in the way solar gains and internal gains utilisation is calculated in a monthly vs hourly model, further investigation is needed to fully understand the reason for this difference.

Model heating demand results:
Total heat demand8445 kWh/y
- Total utilized internal gains:2044 kWh/y of 2201 kWh/y
- Total utilized solar gains:1566 kWh/y of 4132 kWh/y
= Total space heating demand:4835 kWh/y
Total heatpump electricity demand:1611 kWh/y

Running the model for each renewable generation type to investigate the degree of direct supply demand matching we get the following results:

Onshore windOffshore windWaveTidalSolar
Installed capacity0.568kW0.383kW0.651kW0.776kW1.95kW
Percentage of demand
supplied directly
51%57%61%43%10%
Percentage of time demand is
more or the same as the supply
59%59%58%54%41%

Onshore, Offshore and Wave give quite similar levels of matching. Solar PV supplies the least demand because most of the solar electricity is generated in the summer and most of the heating demand is of course in the winter but also importantly when the sun is shining the heat demand is less due to direct solar gains, the dataset we are using for solar pv generation and solar gains is the same dataset.

The online example also explores the effect of adding a very basic thermal store in order to increase the level of supply matching.

The source code and datasets for the heating demand model and full supply/heating demand matching simulation is all open source available in both javascript and python.

Space heating demand varsupply_spaceheatingdemand.py
Space heating demand with heatstorevarsupply_spaceheatingdemand_store.py
Full source code: https://github.com/TrystanLea/zcem

OpenEMC - An emonTH mod for woodworkers

$
0
0
It's fantastic when we get top hear about our energy monitors being used for applications we have never have thought of. Here is one such example:

SolarMill Writes:

We've just published our first open source project! It's called OpenEMC, and it's a code modification for the emonTH sensor by the OpenEnergyMonitor project. OpenEMC translates temperature and humidity readings into an easy to understand equilibrium moisture content (EMC) value, useful for woodworkers and operators of solar kilns.

We’ve been using Open Energy Monitoring components for the past few months for power monitoring and love its open source flexibility.  We recently received an emonTH to monitor Temp and Humidity values in our workshop and have developed a useful modification to the firmware.

emonTH code is on GitHub: https://github.com/solarmill/OpenEMC/tree/origin/emc

Read more about this application on this technical and well written forum post by Bert Green and Andy Fabian.


emonTH in drying box


Stable EMCin Controlled Box

SolarMill make eco-friendly gifts and home decor using solar-powered machinery, they have a super cool looking workshop:


http://www.solarmill.com/

Using a tablet as a wall mount energy display

$
0
0
We've been discussing for a little while using re-purposed tablets for energy display's rather than trying to develop our own pre-assembled version of the EmonGLCD (we're planning on keeping the through-hole version though).

I got myself a refurbished Samsung Galaxy tab 3 last week for £50 off ebay and the Koala Tablet Wall Mount Dock by Dockem.

Here are a couple of pictures of it in action:

Viewing all 196 articles
Browse latest View live